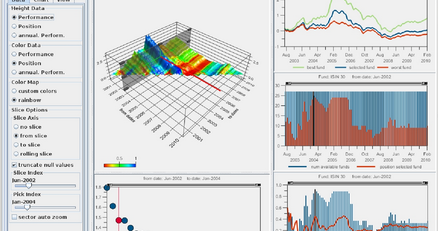
OpenViz from Advanced Visual Systems was designed to overcome these constraints by enabling every constituent in the solution development process to “think outside the chart” and conceive innovative data presentation and user experience concepts that can be executed to demanding design and analytics precision.
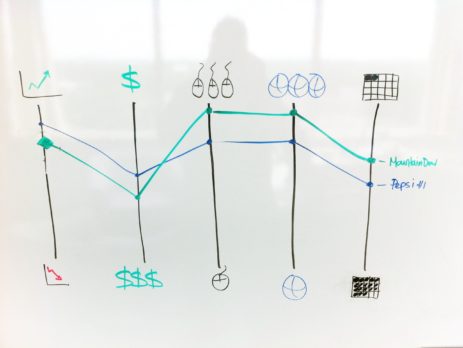
We Start Here:
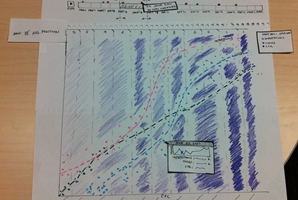
Great software application ideas frequently begin on whiteboards and sketchpads but rarely make it into production because of the limitations imposed on solution development teams by charting packages that lack integrated data handling and layout control features.
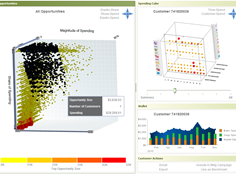
We Finish Here:
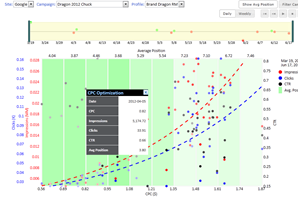
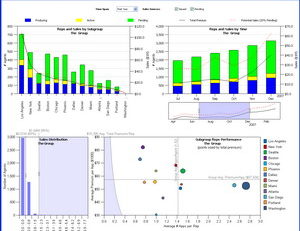
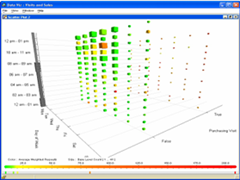
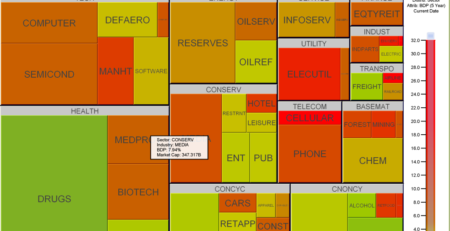
One of AVS’ many clients is a leading advertising agency whose campaign analytics team sought to distinguish its approach to performance management by integrating six dimensions of data into a single-screen visualization that could be displayed in a desktop web browser as well as an iPad. The project was commissioned after numerous attempts to present a correlation between metrics using a traditional dashboard approach was abandoned due to poor reception by end users that were unable to quickly spot the convergence of trends. OpenViz enabled the team to achieve their objective in a compelling example of interactive analytics driven by creative data visualization.
Significant features include HTML5 animation generated from local browser resources with stop/rewind/fast-forward features; AJAX interactivity calibrated to dynamic values in memory; six uniquely labeled dimensions of data with dynamic legends; dynamic and conditional transparency over binned value ranges; rules-based curve plotting in multiple colors based on dynamic in-memory calculations; rapid query of large analytics database; and rich tooltips designed for easy iPad deployment.
OpenViz — turn your ideas into interactive insights.