Choose Something You Can Use Yourself with AVS/Express
Would you like to work with a team that provides its expertise no matter what solution you choose? At AVS, our team will work in unison with your to reach your development goals. Both non-programmers and experienced developers love AVS/Express’s drag-and-drop capabilities, rapid user-interface, advanced visualization methods, and cross-platform compatibility. Our clients in the engineering, medicine, telecommunications, and environmental research fields can handle heavy graphics demands with AVS/Express thanks to its intuitive interface.
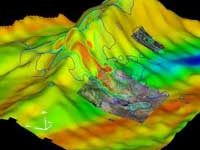
In a Scientific, Academic, High-Performance Field?
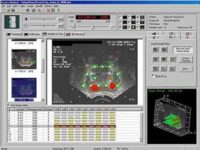
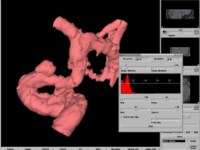
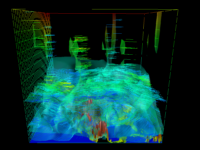
Then you don’t have time to waste on low-end solutions — you need something that will last and evolve to your needs. AVS/Express gives you everything you need to connect elements and create your vision one piece at a time. Quickly form 3D visuals of your data that can intersect parallel, perpendicular, etc., to one another by simply connecting the data inputs to the outputs. AVS/Express in an end-user platform, containing easy-to-use objects, data structures, and libraries specifically designed to analyze and visualize large/complex datasets and turn them into perceivable insights. With AVS, you won’t have to worry about being left on your own.
Choose an Edition That Suits Your Needs

Visualization Edition
with drag-and-drop modules

Multipipe Edition
immersive and virtual reality environment

Developer Edition
and share it with your End-Users

Parallel Edition
in the Cloud or HPC environment
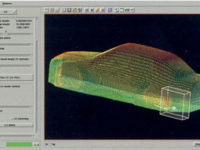
Quickly Create Effortless Data Visualizations from Scratch
We created AVS/Express for those who’d rather not worry about coding, which is what OpenViz requires. After very introductory learning of how Express works, you’ll be on your way to making your own visualizations. With AVS/Express, you can identify which modules can connect to one another using color coding to easily drag a module onto a canvas and then connect it to a data source. From this, you can effectively create your own data management pipeline.
From the pipeline you created, the presentation side allows for feedback to the data management pipeline to then play through different scenarios that you can choose and develop yourself. So, they’re actually linked via interaction tool tips so that they work in unison! Join the thousands of corporations, solution providers, academic institutions, and government agencies that have already selected AVS/Express to provide powerful insights to inform their business and provide better services and/or products to their customers.